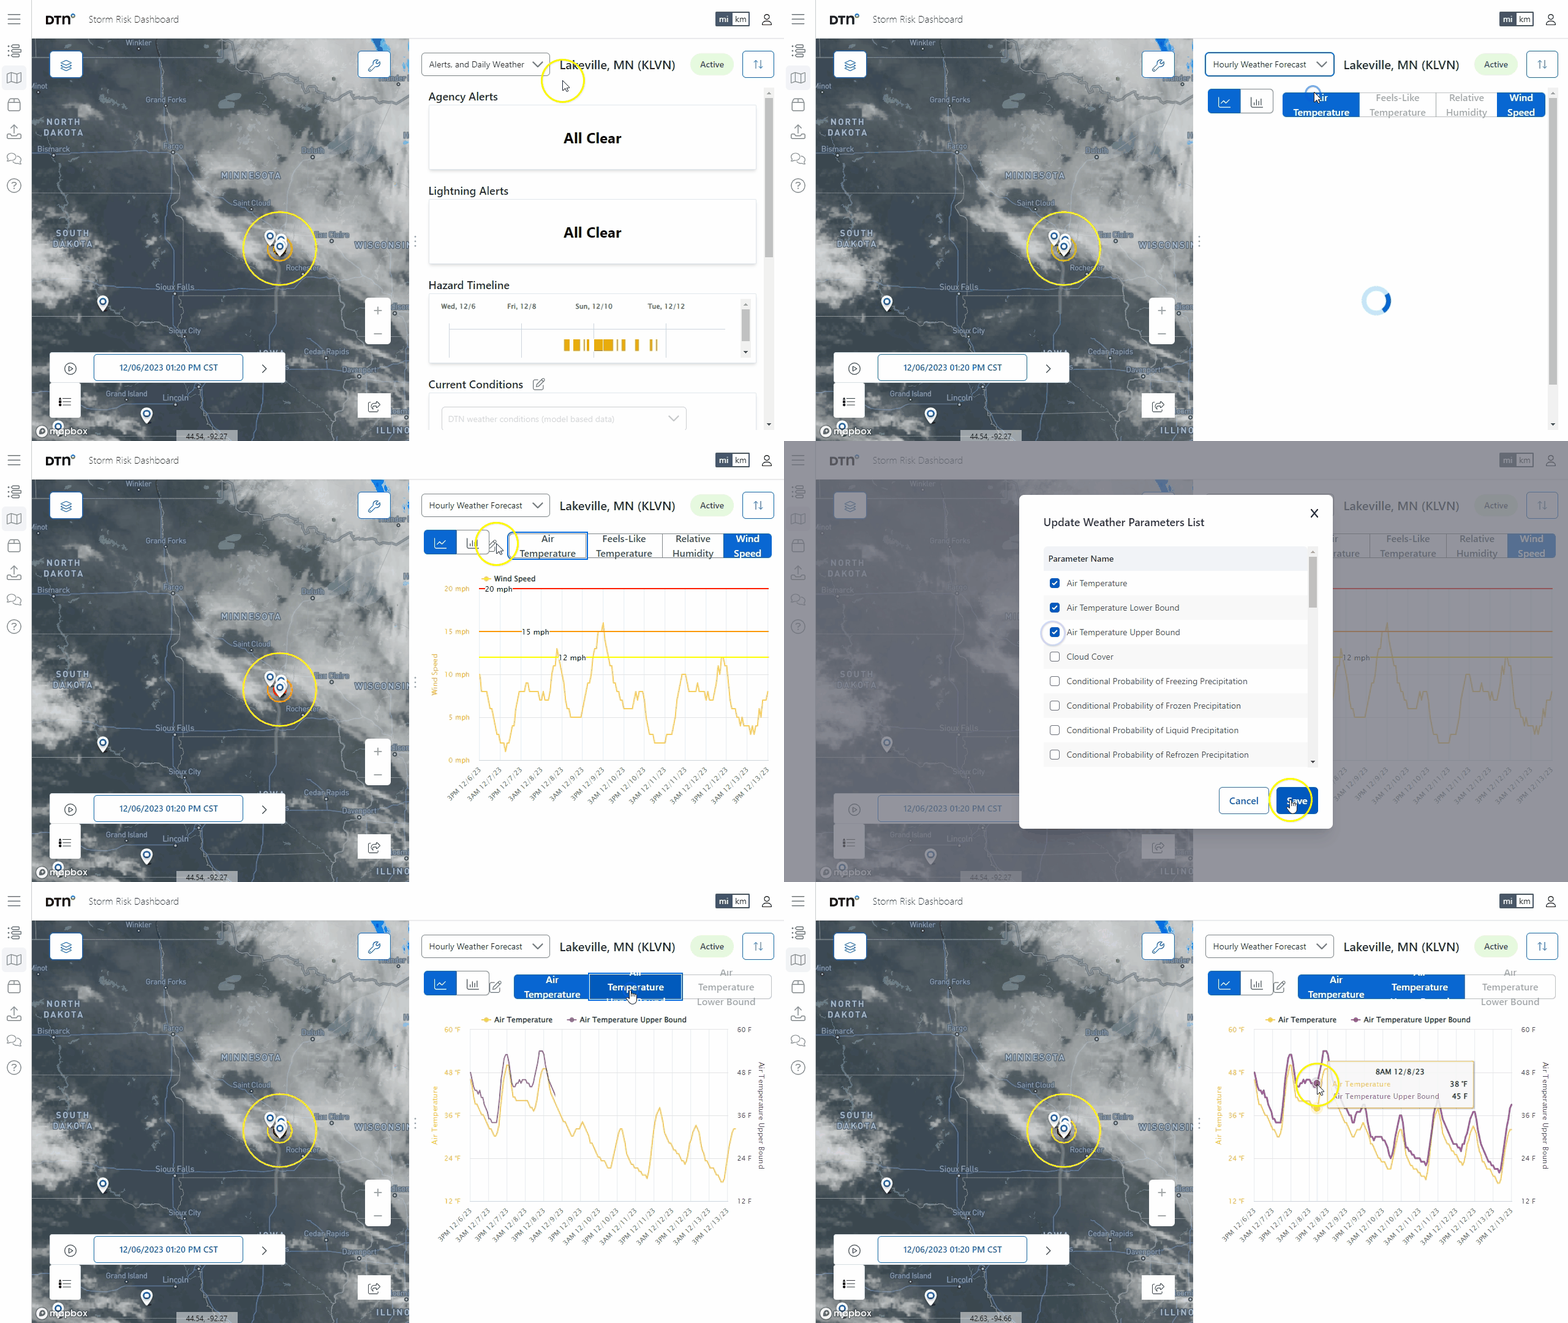
To display the DTN hourly weather forecast for your asset, click on the drop down menu in the upper left corner of the status page for your asset and choose “Hourly Weather Forecast”.

Click on the weather parameters at the top of the page to enable/disable them in the weather forecast graph. Click on the line or bar graph icons to choose which type of graph you would like to display.
![]()
You can modify what weather parameters are contained in the graph by clicking on the edit icon and selecting between two (2) and four (4) weather parameters to plot in the graph.
![]()
Move your mouse over the line or bar graph to see the precise weather values at that time.
